Carbon Report 2018
Carbon offset
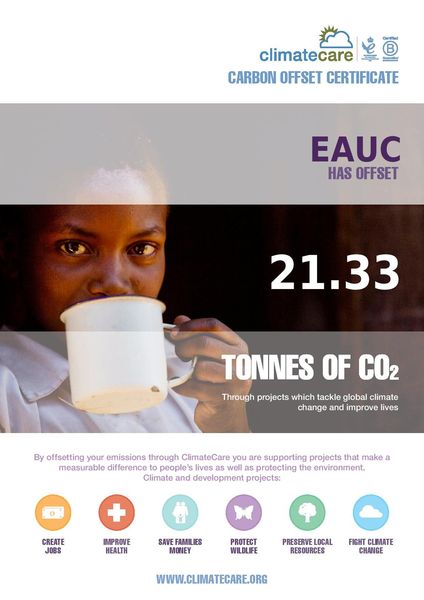
We try to minimise our carbon footprint as much as possible, however as with any organisation we do still have a carbon footprint. We continue to offset this using Climate Care. Whilst our actual carbon use was 14.8 tonnes of carbon dioxide, we were pleased to see in the final report that we exceeded our actual offset by 6.53 tonnes. This fits our aim to minimise our carbon footprint as much as possible. We chose Climate Care, based on their recognition as world leaders in the carbon offset market. Moreover, we want to ensure that we establish partnerships with stakeholders that do not only aim to reduce the carbon footprint, but also to improve lives in the areas in which they operate.
2018 results
- Our carbon footprint has increased slightly by 3.37% and now sits at 14.8 tonnes for the 2018 period
- The main increase in our carbon footprint is due to a higher number of staff employed in 2018
- Our staff full time equivalent (FTE) increased from 7.90 to 9.37
- Average carbon emissions per FTE staff member is 1,574kg CO2 which is 13% less than in 2017
- Less than 7% of our waste goes to landfill.
Carbon Summary
| Staff (FTE | Total Carbon Emissions (kgCO2) | Carbon Emissions per FTE (kgCO2/FTE) | Income per annum £ | Carbon Emissions per unit of income (kgCO2/£) | GIA (m2) | |
|---|---|---|---|---|---|---|
| 2017 | 7.90 | 14,277 | 1,808 | 608,311 | 0.0234 | 250 |
| 2018 | 9.37 | 14,75 | 1,574 | 637,734 | 0.0231 | 259 |
| % increase/ decrease | 19% | 3% | -13% | 5% | -1% | 3% |
| 2018 kgCO2 |
2018 % |
2017 kgCO2 |
2017 % |
Variance kgCO2 |
Variance % |
|
|---|---|---|---|---|---|---|
| Waste | 20 | 0.13 | 10 | 0.07 | 10 | 50 |
| Water | 36 | 0.24 | 30 | 0.21 | 6 | 17 |
| Heating & Lighting | 3,835 | 26 | 3,771 | 26 | 64 | 2 |
| Travel | 10,270 | 70 | 9,958 | 70 | 312 | 3 |
| Domestic | 6,193 | 42 | 4,646 | 33 | 1547 | 25 |
| International | 4,077 | 28 | 5,312 | 37 | -1235 | -30 |
| Electricity | 597 | 4 | 507 | 4 | 90 | 15 |
| Total | 14,757 | 100 | 14,277 | 100 | 480 | 3 |
We calculate our staff and Board business travel, workstation energy use and working at home energy use. We also report on other carbon use which is based on reporting scope as highlighted below:
| Office Area (m2) | Electricity | Gas | Water | Travel | Waste | Procurement | |
|---|---|---|---|---|---|---|---|
| Headquarters, Cheltenham | 45.12* | Tenant within office space with little or no control of Electricity (lights) or means to measure consumption. | Tenant within office space with little or no control of Gas or means to measure consumption | Tenant within office space with little or no control of Water or means to measure consumption | All travel is based on estimates of mileage and using Defra conversions | Tenant within office space with no means to measure consumption. Waste audit undertaken and assumptions are based on this for the year | Accurate data for procurement areas is not available at this time but adheres to our purchasing policies |
| Scotland Office | 11.94** | Desk usage is monitored via socket meters |
** Our Scotland office is part of an open plan office, so this figure is calculated based on average FTE space in our Headquarters
- All business activities including staff and Board travel, workstation energy use, home working energy use, travel energy use, waste, water, lighting and heating is recorded.
- Due to our shared offices, some of our services are controlled by our host institutions such as lighting and water, therefore we are unable to measure these separately.
- The host institutions collect the recycling and landfill waste centrally, so we have an annual waste audit and base an assumption on this for the year.
- We include the travel incurred by our trustees (based on reimbursements, so any travel that is not reimbursed will not be included).